petB intron from 4-10 through 4-18

Katrina Underhill and Nicholas Cherney performed PCR amplification on the extracted DNA from nine orchid species. The DNA was previously extracted by fellow students and Dr. Jarrell. The objective of this procedure was to amplify the petB intron in DNA samples 4-10 through 4-18.

The results showed that five of our nine specimens had a good yield. Two of our specimens had a mildly successful yield, Thrixspermum bromeliforme (4-13) and Renanthera storei (4-15). Cleisostoma subulatum  (4-10) and Holcoglossum flavescens (4-14) failed to produce product entirely. After comparing our results with the molecular mass ruler provided by Dr. Jarrell, the majority of our samples appear to be around 1000 bp while our two lower yields appear to be around 500 bp.

Table 1: PCR Results

Lane

DNA Code

Species Name

PCR Yield

1

Gel marker

2

Control

3

4-10

Cleisostoma subulatum

4

4-11

Chroniochilus virescens

++

5

4-12

Ceratocentron fesselii

++

6

4-13

Thrixspermum bromeliforme

+

7

4-14

Holcoglossum flavescens

8

4-15

Renanthera storei

+

9

4-16

Trichoglottis amesiana

++

10

4-17

Omoea philippinensis

++

11

4-18

Gastrochilus acutifolius

++

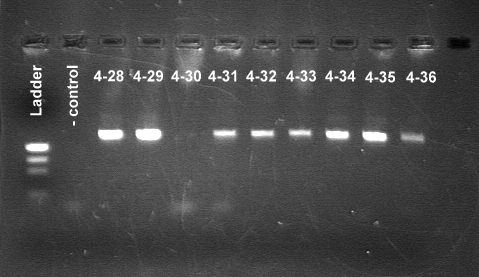
petB intron from 4-28 through 4-36

Samantha Schwartz and Coral Thompson performed PCR amplification on the extracted DNA from ten different orchid species. The DNA was previously extracted by fellow student researchers and Dr. David Jarrell. The objective of this procedure was to amplify the petB intron in DNA samples 4-28 through 4-36.

A gel marker was run in lane 1 and a negative water control was run in lane 2. The results showed that all of our specimens had high yield except for Diaphananthe pellucida (4-30) which failed to produce product entirely and Tridactyle tridentata (4-36) had a mildly successful yield. All of the PCR products ran slower than the 1000 bp fragment of the Molecular Mass Ruler. Therefore these products are larger than 1000 bp.

Figure 1: Gel Electrophoresis ran by SS & CT

Lane Number DNA Code Species PCR Results
1 Ladder
2 Negative Control
3 4-28 Polyrrhiza lindenii ++
4 4-29 Gastrochilus fuscopunctatus ++
5 4-30 Diaphananthe pellucida
6 4-31 Sarcoglyphis comberi ++
7 4-32 Sarcophyton pachyphyllus ++
8 4-33 Phalaenopsis taenalis ++
9 4-34 Polystachya longiscapa ++
10 4-35 Cyrtorchis monteirae ++
11 4-36 Tridactyle tridentata +

petB intron for 4-1 through 4-9

Brandon J. and Duong V. used PCR to amplify the petB region of  nine DNAs. A total of nine samples were used including a marker lane 1, and water lane 11, as illustrated in the photo (Figure 1). The nine samples of extracted DNA were then prepped for gel electrophoresis. The gel was created, then it was placed in the electrophoresis equipment, samples were added to it, and the electrophoresis equipment was turned on to create a charge for a period of time. This was all done followed by instructions given from Dr. Jarrell.  Based on the Molecular Mass Ruler these products  are larger than 1000 bp because the products in Figure 1 ran slower than  the Mass Ruler sample provided.

The results of the gel electrophoresis is listed in the table below (Table 1). The fluorescent bands contained near/in the wells is unknown, it could be caused by some of the DNA stain coming out of solution, causing it to stay in the wells or poorly migrate out of them. Also alternative explanation is that the running buffer had been previously used and some DNA stain was left over from prior runs.

Figure 1


PCR Success Results:

++ High

+ Low

-No Success

Table 1

Lane

DNA code

Genus Species

PCR Results

1

Blank

Gel Marker

N/A

2

4-1

Chiloschista segawae

++

3

4-2

Phalaenopsis viridis

++

4

4-3

Rhynchostylis gigantea

+

5

4-4

Holcoglossum subulifolium

+

6

4-5

Phalaenopsis equestris

7

4-6

Rhynchostylis coelestis

+

8

4-7

Angraecum didieri

++

9

4-8

Aerangis luteo-alba

10

4-9

Cleisostoma schneideri

++

11

Negative control

Water

N/A

petB intron from 4-37 through 4-44

Blake  Jones and Jennifer Walden set up the reactions.  We were unable get results for (4-39,4-40, and 4-43) (Lane 4,5 and 8).  Low yields were obtained from these gels due to errors in set up.  Somewhere in the process of setting up we were a sample short than expected.  Also an error could have occurred in the loading of our samples into the gel.  This would account for the other two samples not obtained.

PCR (Polymerase Chain Reaction) was run from our extracted DNA. After PCR, we ran an Agarose Gel Electrophoresis to get the size of our base pairs (Figure 1).

Estimated size of PCR products are anywhere from 1250-1300 bp when using the standard curve from our DNA Ladder (Figure 1).

Figure 1

Figure 1
High Yields achieved for:4-37,4-38, 4-41, 4-42, 4-44
Low Yields achieved for:4-39, 4-40, 4-43


Lane nuber DNA Code Genus Species PCR Results
1 Ladder
2 4-37 Jumellea comorensis ++
3 4-38 Aerangis biloba ++
4 4-39 Phalaenopsis stuartiana
5 4-40 Phalaenopsis amboinensis
6 4-41 Phalaenopsis gigantea ++
7 4-42 Paraphalaenopsis serpentelingua ++
8 4-43 Adenoncos sp.
9 4-44 Papilionanthe pedunculata ++
10 Empty

petB intron from 4-19 through 4-27

Courtney V. and Chandler G. used PCR to amplify the petB intron of the DNA extracted from nine orchid species. Nine samples and a negative control, water,was used to for gel electrophoresis (See figure 1). All my PCR products ran slower than the 1000 bp fragment of the Molecular Mass Ruler.  Therefore, these products are larger than 1000 bp.  The location of the  petB  intron was determined by looking at a genome sequence of chloroplast of  Phalaenopsis aphrodite  that Dr. Jarrell provided us with. The petB region is on the left hand side of the sequence and is included with the genes that code of photosystems 1, 2 and the B6/f complex.

The results of our gel electrophoresis are  listed in the table below (See table 1). We did not run a gel marker in lane one as instructed. Our group shared a gel with another group so we only ran one marker, which was on the top of the gel. Our results were on the bottom of the gel which excluded the marker.   The cause of the light background is unknown.  Pippetting errors may have been the cause of some samples having a negative success. Making the gel, as well as loading and running the gel was done exactly as instructed.

Figure 1: Gel electrophoresis for DNA samples 4-19 to 4-27

                                                                                                                                                                                                     ++ high success                                                                                                                                                                                                          + success                                                                                           Table 1                                                                                                   – no success

Lane DNA code Species or Marker Success
1 Blank Blank n/a
2 4-19 Trichoglottis bipunctata +
3 4-20 Malleola constricta
4 4-21 Phalaenopsis lobbii +
5 4-22 Armordorum siamense
6 4-23 Grosourdya appendiculata ++
7 4-24 Smitinandia micrantha ++
8 4-25 Acampe papillosa ++
9 4-26 Schoenorchis fragrans
10 4-27 Drymoanthus minutus ++
11 -DNA control Water n/a